![]()
Statement of Purpose
The Family First Prevention Services Act (FFPSA) created an avenue for states to use federal funds for a limited number of evidence-based programs (EBPs) for youth and their families in order to prevent out-of-home placements, where such interventions are indicated and deemed safe. Virginia included eight services in the state plan, Brief Strategic Family Therapy (BSFT), Family Check-Up (FCU), Functional Family Therapy (FFT), High Fidelity Wraparound (HFW), Homebuilders (HB), Motivational Interviewing (MI), Multisystemic Therapy (MST), and Parent-Child Interaction Therapy (PCIT).
The following report provides available data on how all cases for five of these services (BSFT, FCU, FFT, HFW, and MST) are funded in Virginia.
BSFT Case Funding Sources
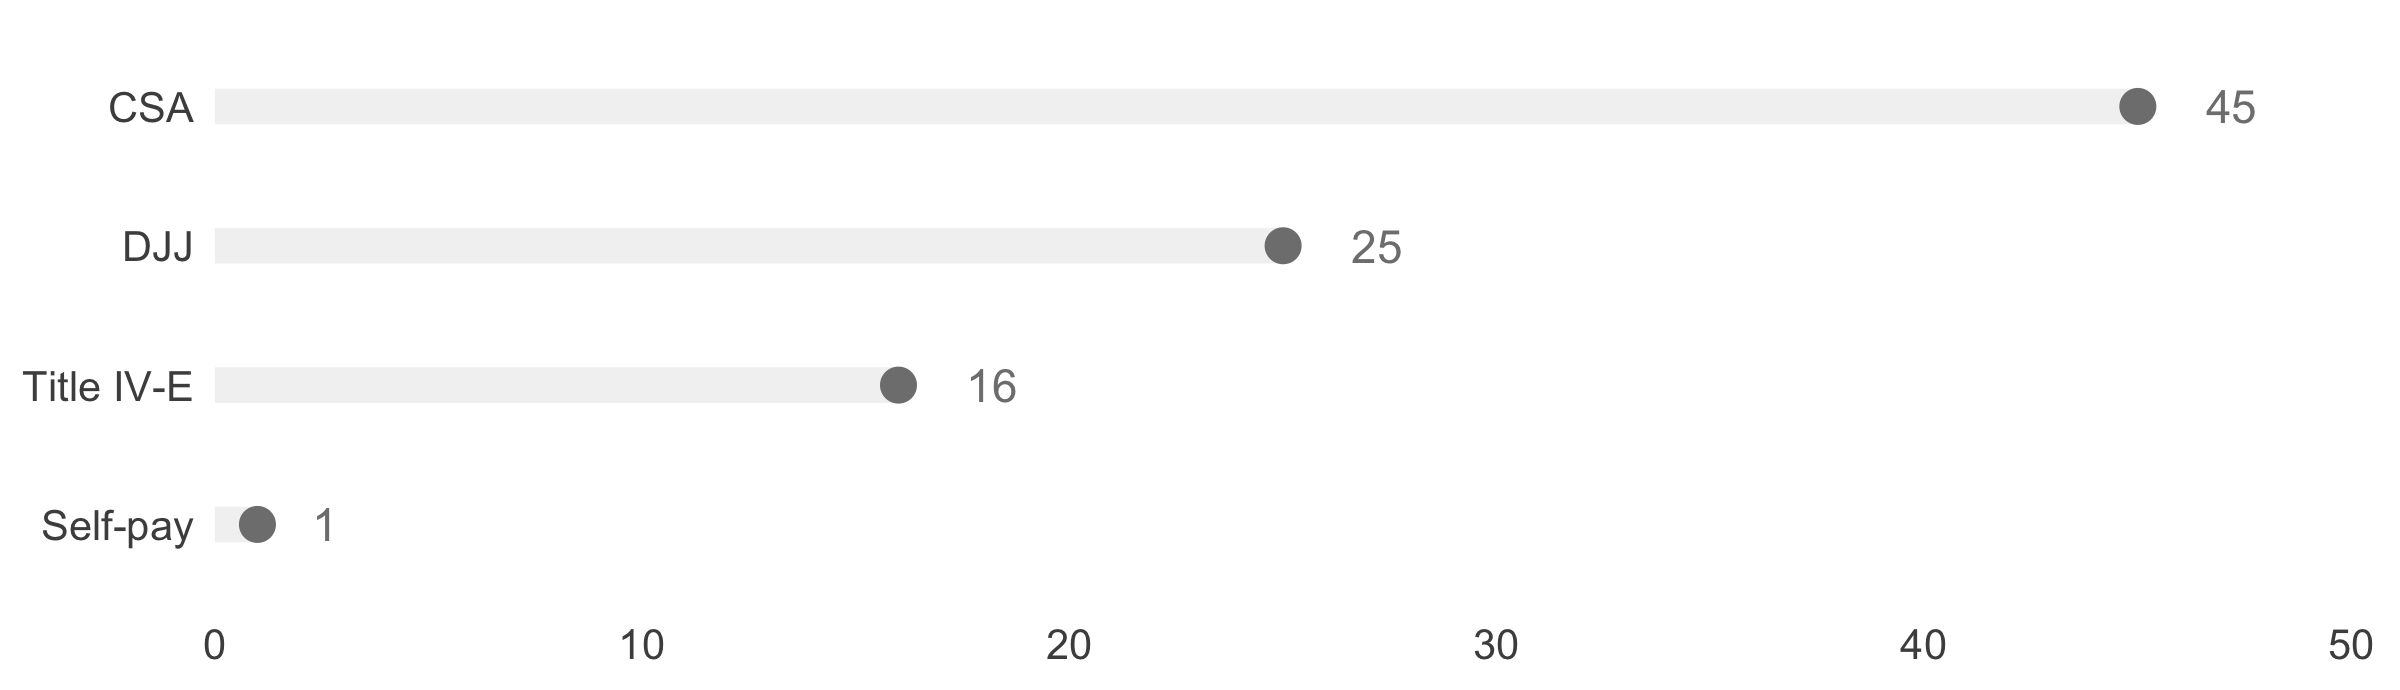
Figure 1. Funding source information for BSFT cases seen from January-March 2025
Figure 1 breaks down the number of cases funded by major payors in the state, as reported by provider companies. One provider company was not able to provide this information in time to be included in the report. Based on available data, BSFT is the EBP with the highest share of cases funded using Title IV-E Family First Prevention funds, 18% from January to March 2025.
FCU Case Funding Sources
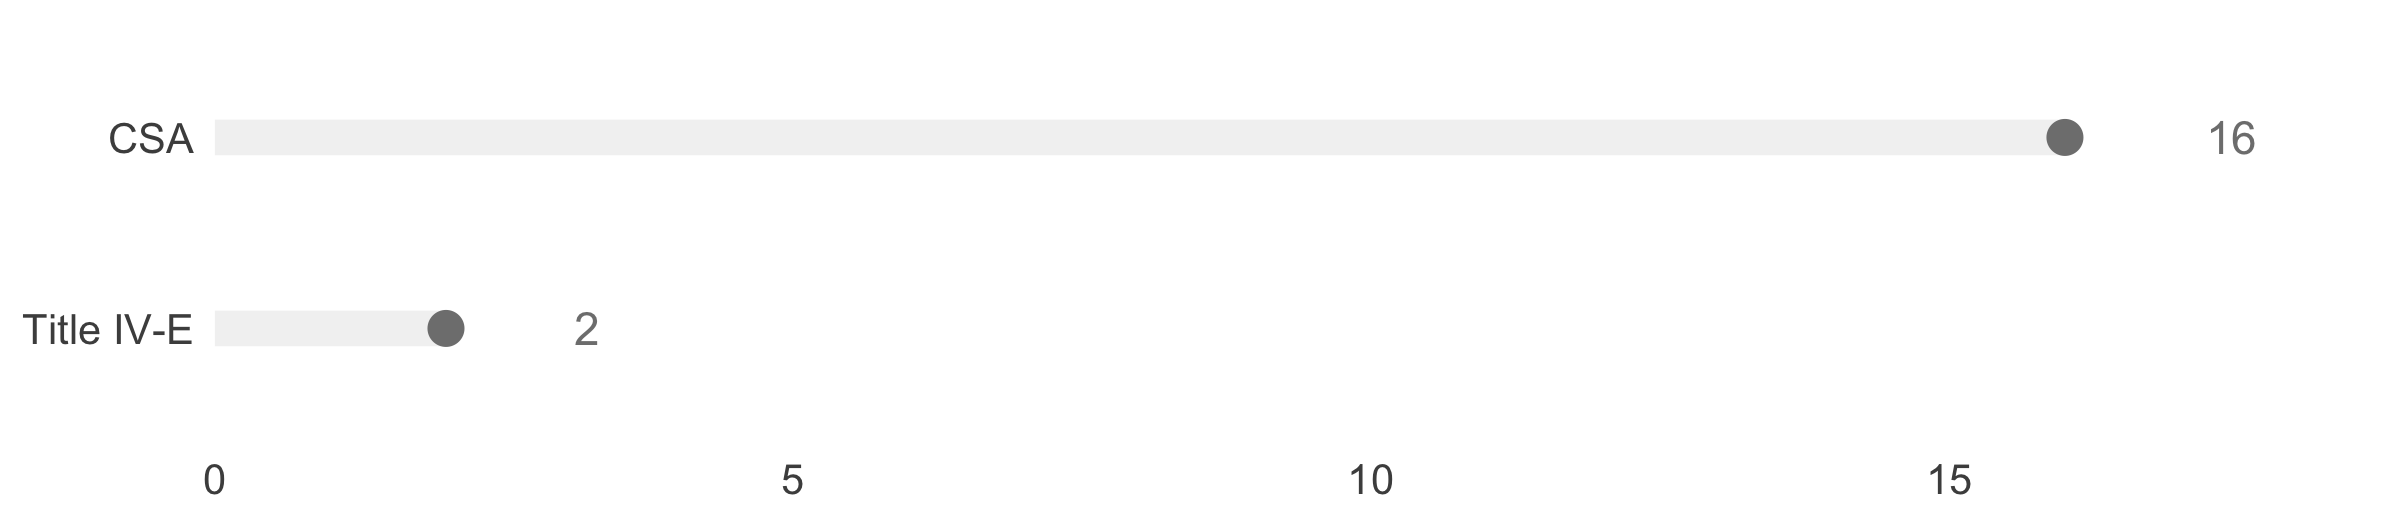
Figure 2. Funding source information for FCU cases seen from January-March 2025
Figure 2 breaks down the number of cases funded by the two payors in the state, as reported by provider companies, Children’s Services Act (CSA) and Title IV-E. From January to March 2025, Title IV-E funding covered 11% of FCU cases in Virginia.
FFT Case Funding Sources
Figure 3. Funding source information for FFT cases seen from January-March 2025
Figure 3 breaks down the number of cases funded by major payors in the state, as reported by provider companies, with Medicaid funding the most cases, followed by the Department of Juvenile Justice (DJJ) and CSA.

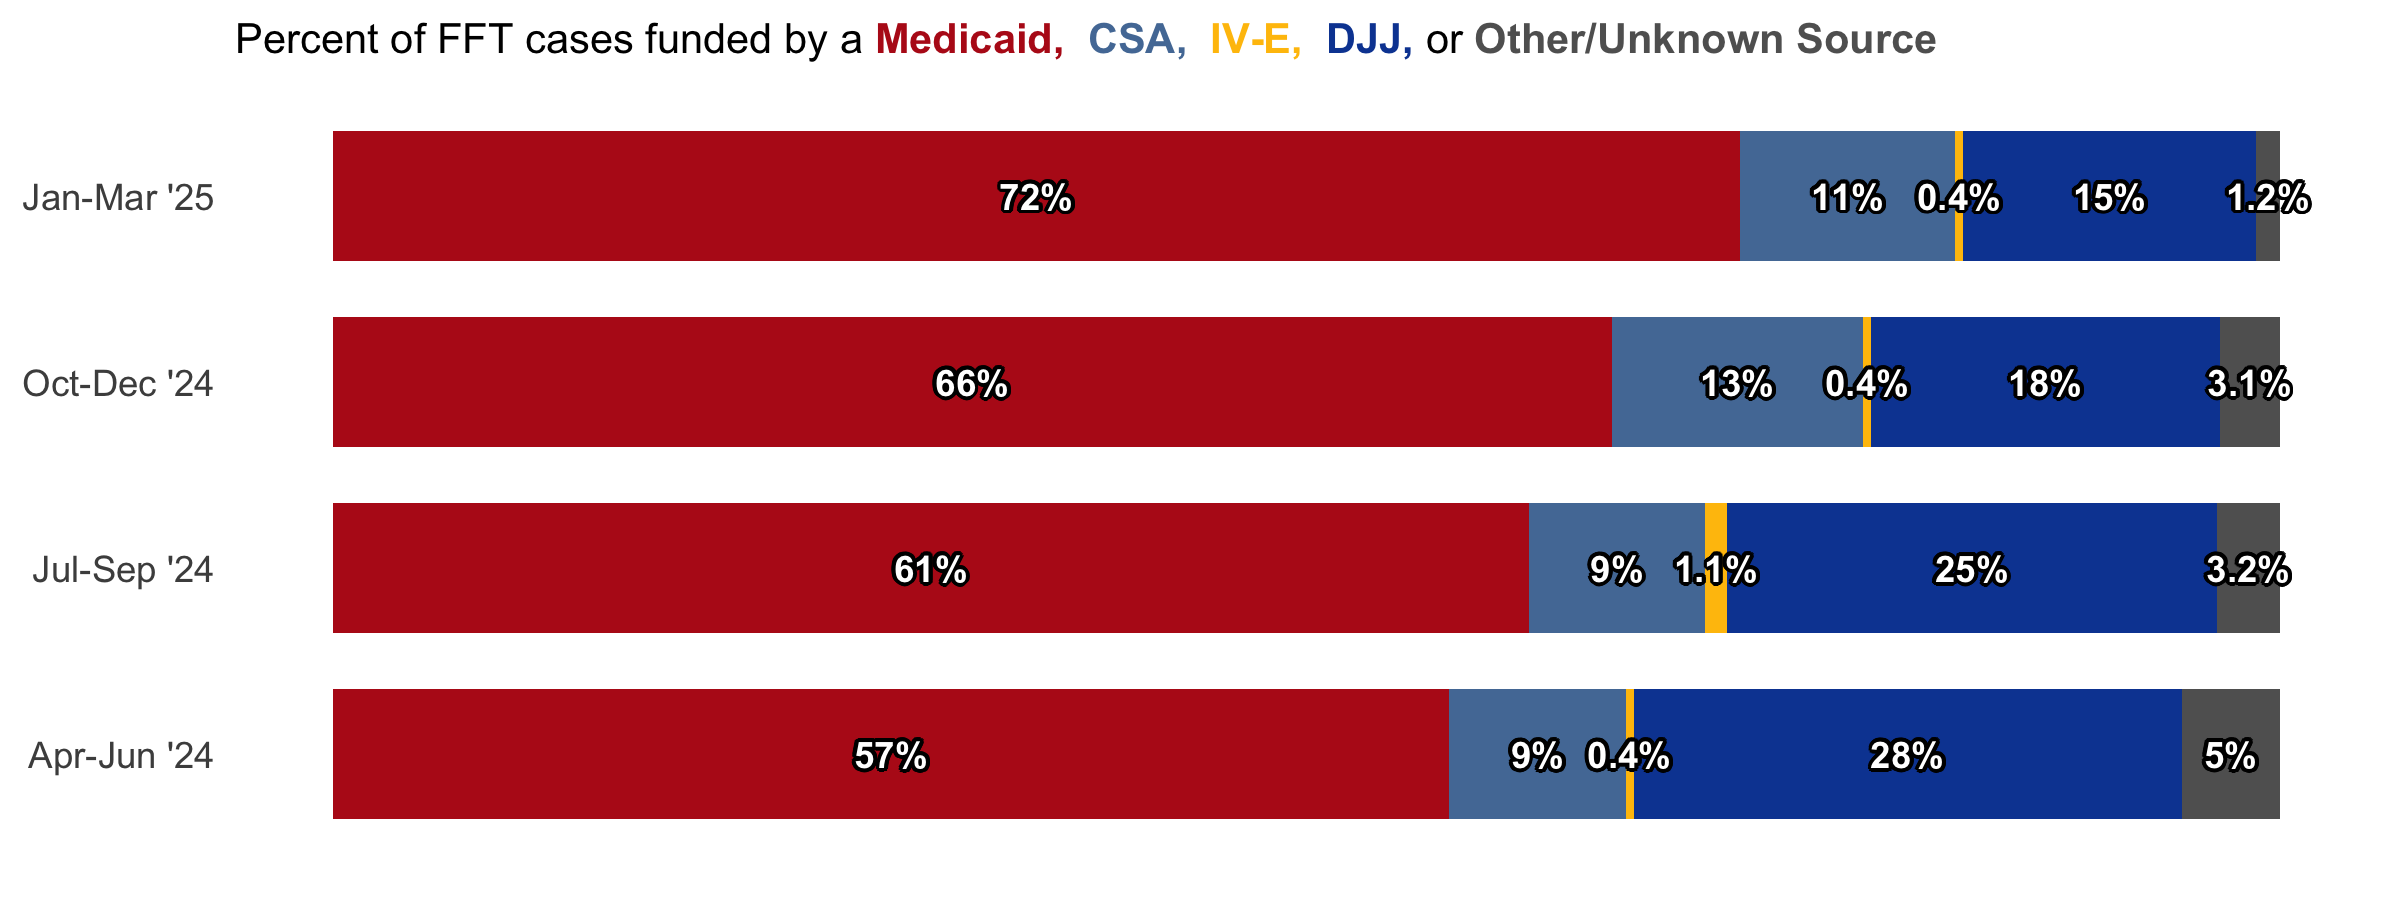
Figure 4. Funding source information for FFT cases seen from April 2024 to March 2025
Figure 4 compares the breakdown of each funding source by quarter, where the share of Medicaid-funded cases relative to nearly all other funding sources has steadily grown over the past year.
HFW Case Funding Sources
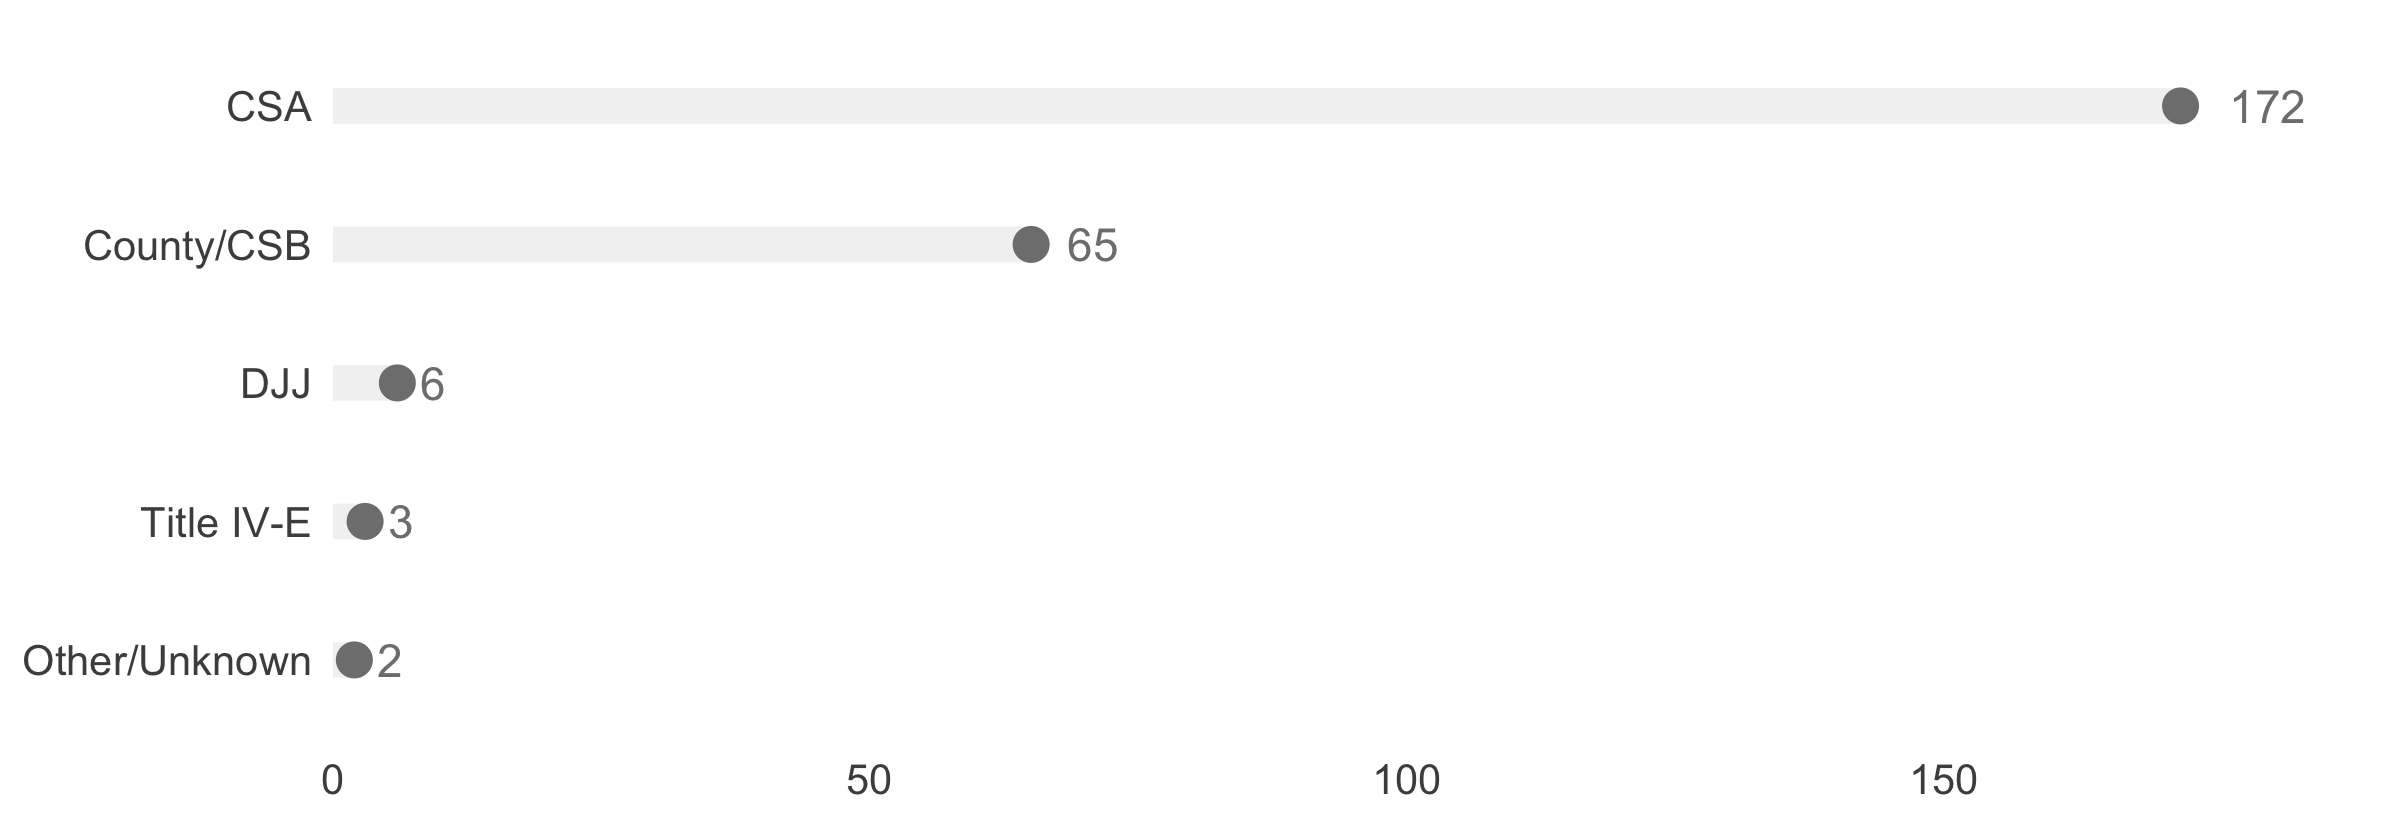
Figure 5. Funding source information for HFW cases seen from January-March 2025
Figure 5 breaks down the number of cases funded by major payors, as reported by provider organizations for known cases (CEP-Va estimates an additional 30 cases were served during this period, but are unaccounted for). The data show that CSA is the major funder of HFW cases in Virginia, followed by County and Community Service Board (CSB) funding.
MST Case Funding Sources
Figure 6. Funding source information for MST cases seen from January-March 2025
Figure 6 illustrates the number of MST cases funded by each of the major payors.
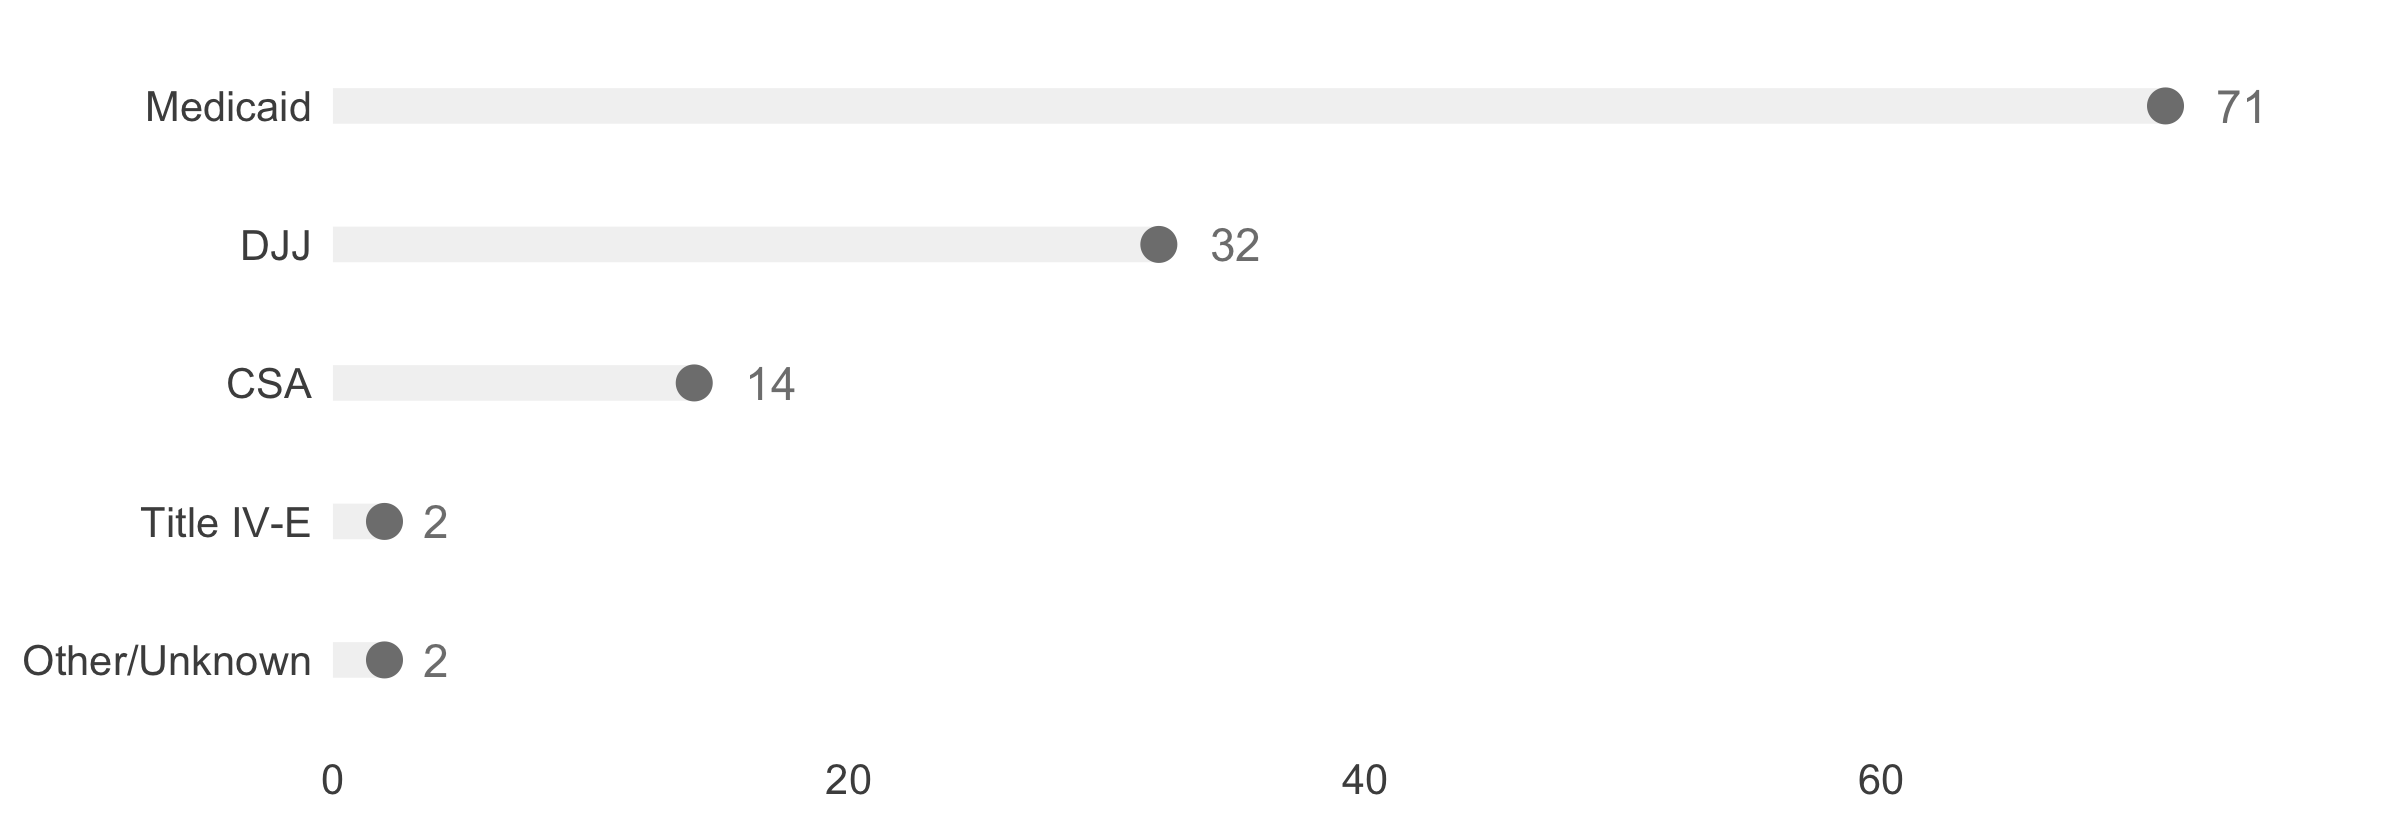
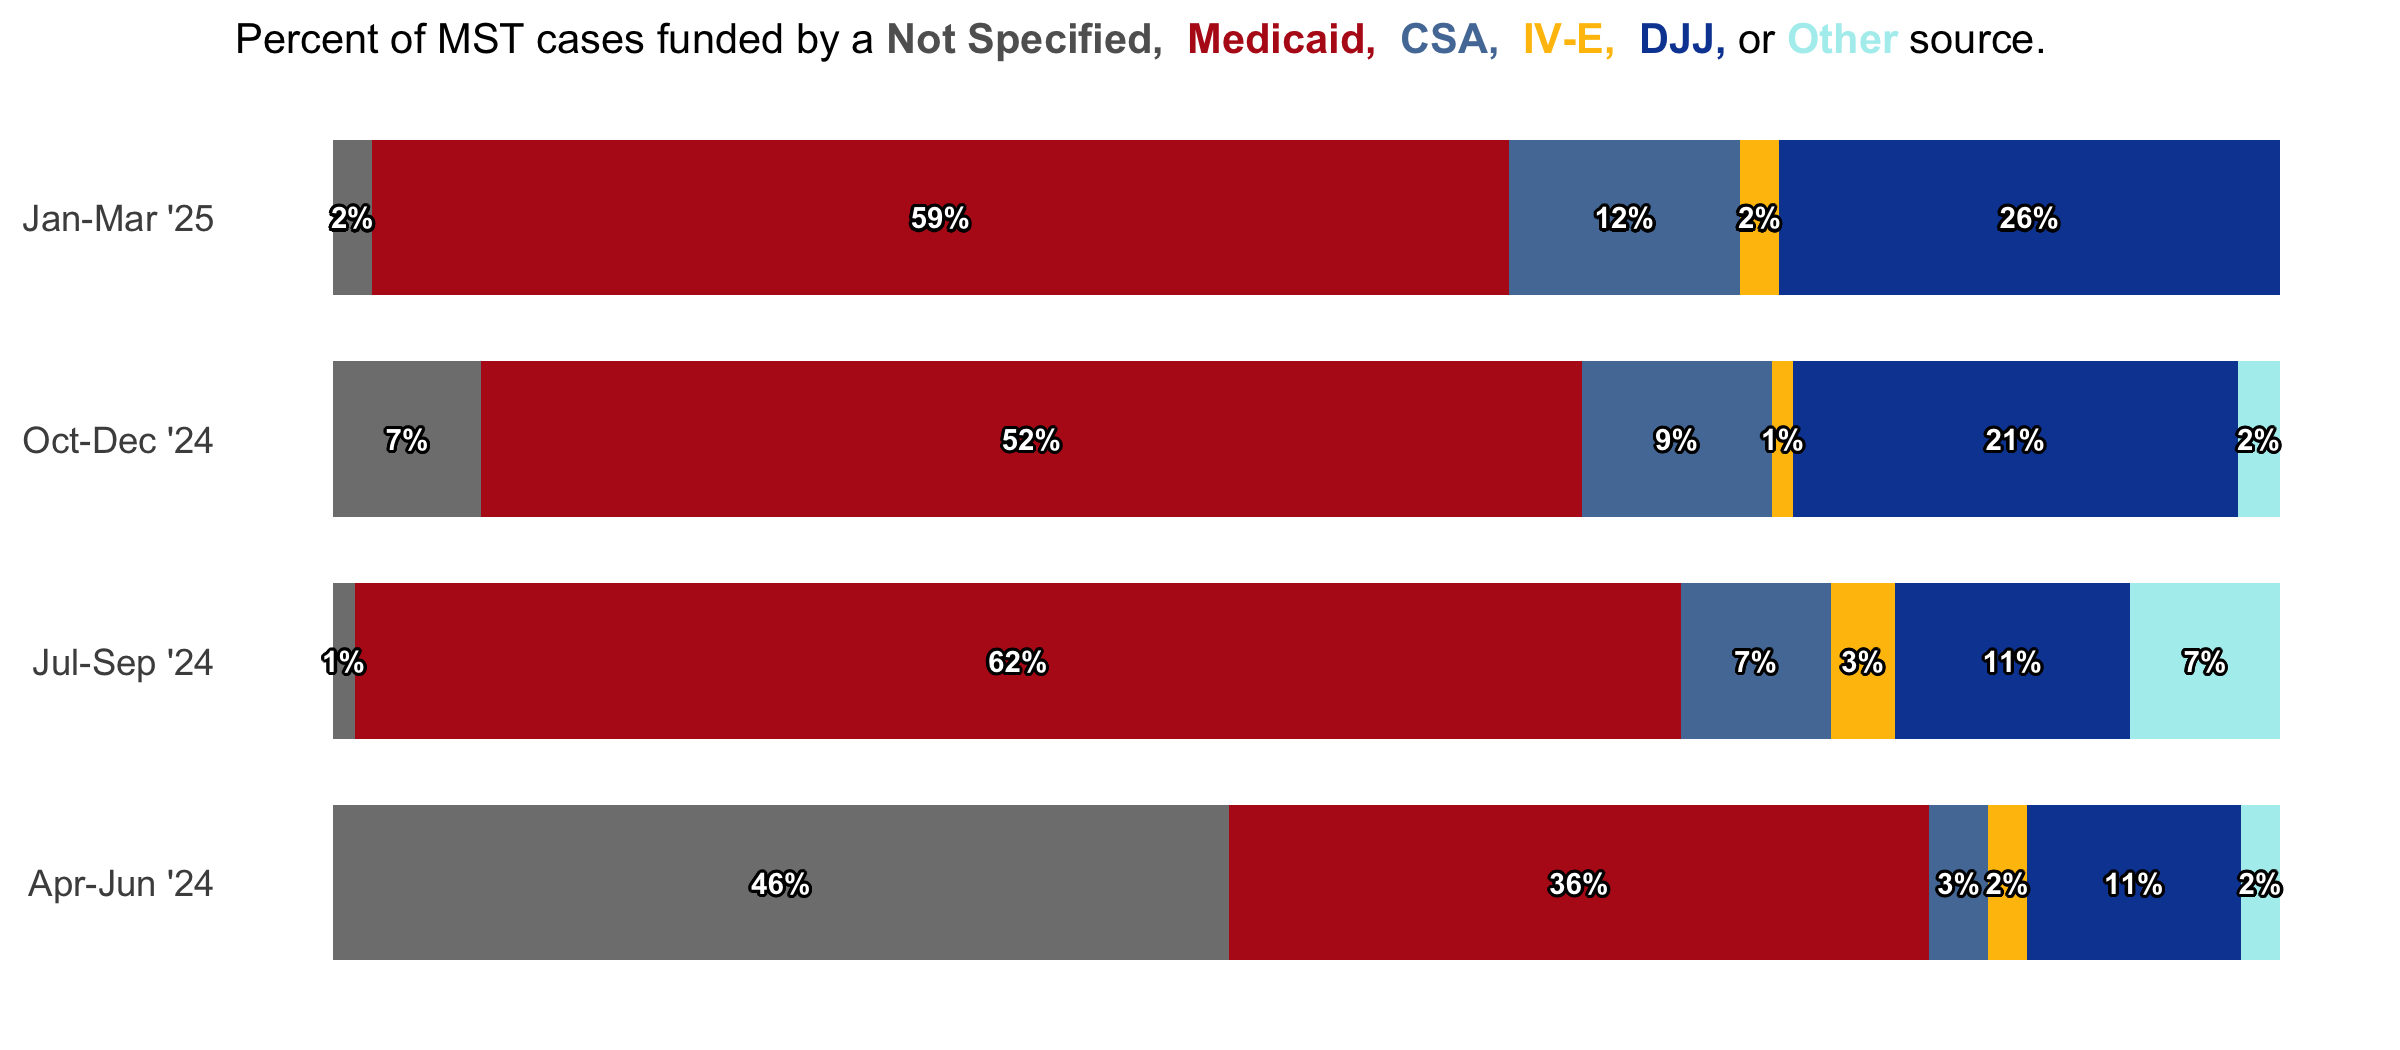
Figure 7. Funding source information for MST cases seen from April 2024 to March 2025
Figure 7 compares the breakdown of each funding source by quarter. In the last year, DJJ is the funding source that has grown the most, relative to other reported funding sources.
All Funding Sources
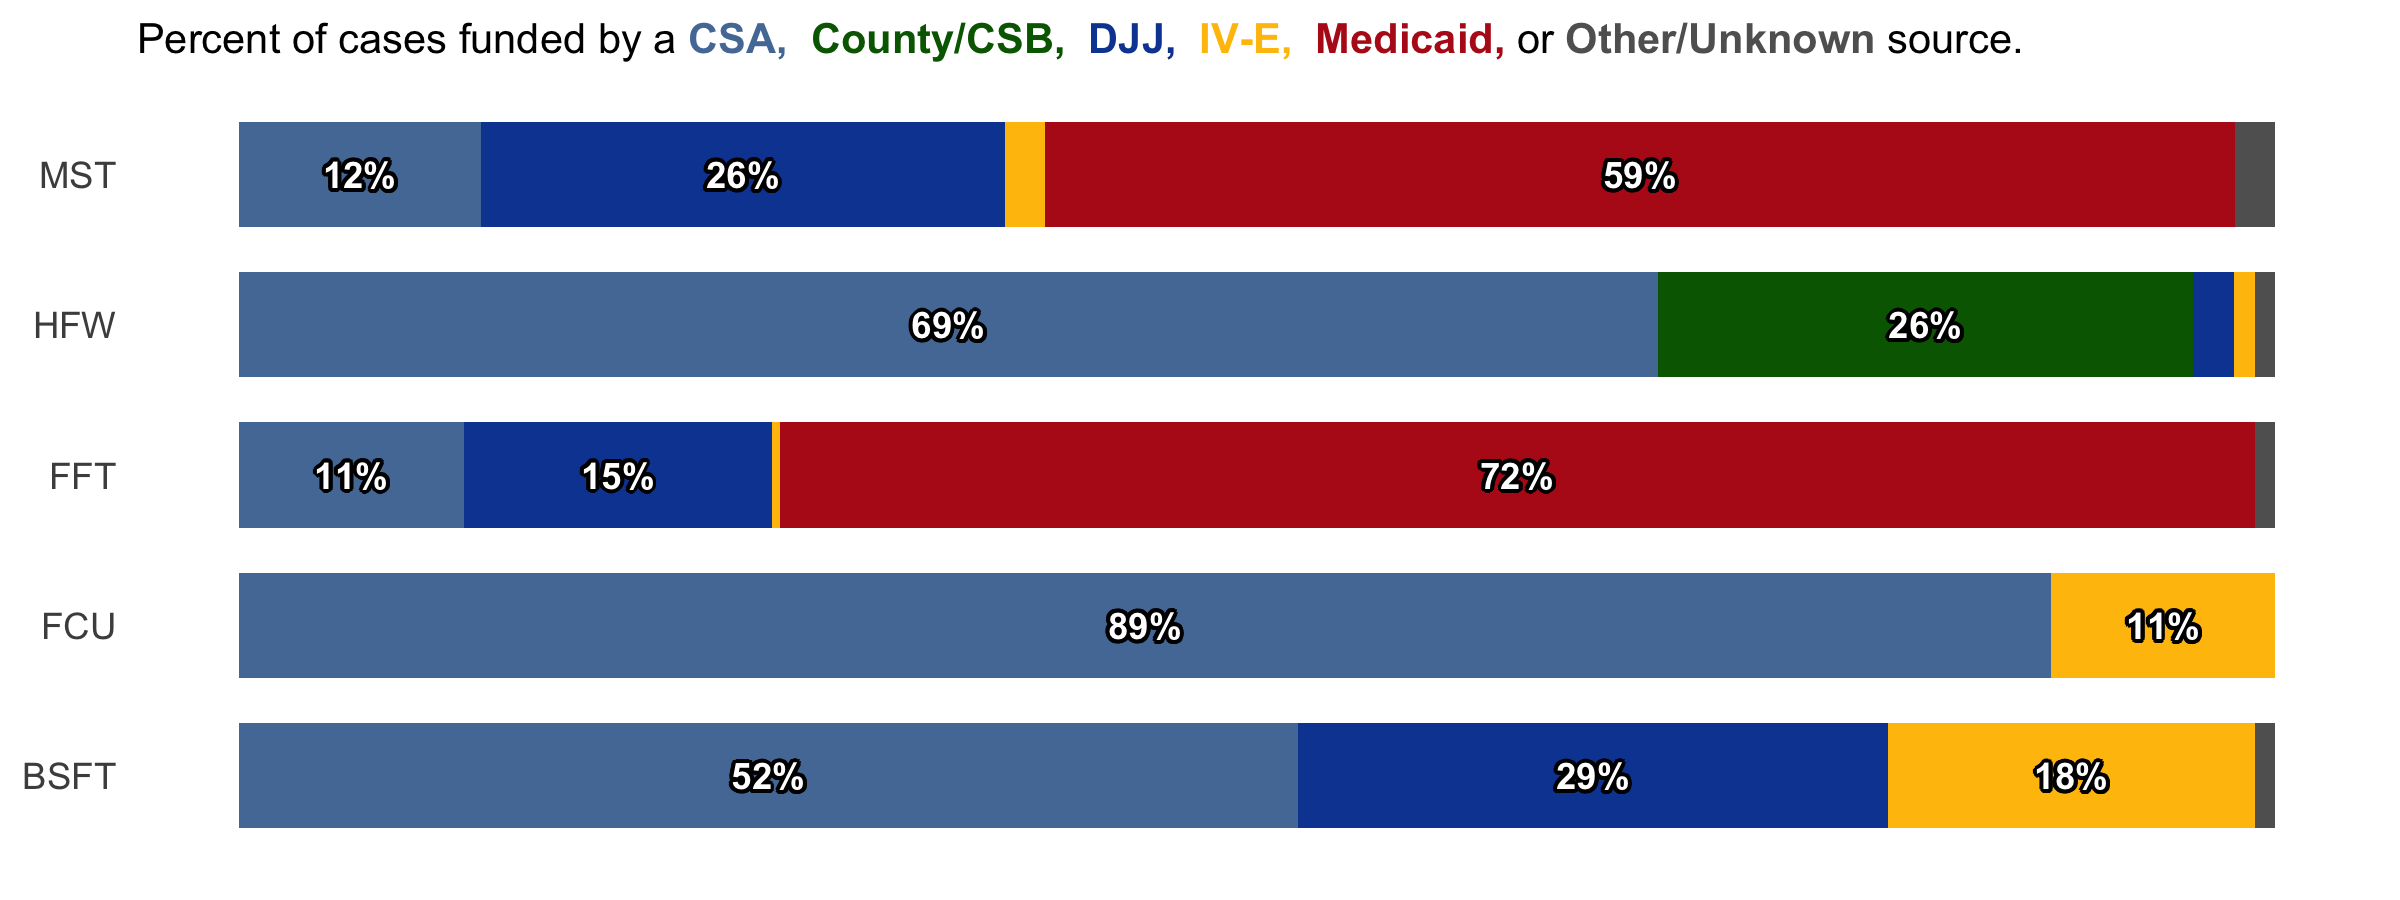
Figure 8. Funding source percentages from January-March 2025
Figure 8 compares the share of cases paid for by each major funding source. Note that this figure is not representative of the total number of cases; the EBPs with the lowest and highest number of cases are FCU at 18 and HFW at 248, respectively.